Summary:
The Geographic Information Systems (GIS) assessment of the effects of road density and forest cover change on bull trout habitat in the Methow River watershed found that the average road density of all the WAU subbasins was 1.1 km/km2 (Table 1). The assessment also found that the region experienced an overall increase of 114.2 hectares of forest cover (Table 1). Although there was an overall increase in forest cover within WRIA 48, there was a decrease in riparian buffer of 6.11 hectares (Table 1). This overall average decrease in riparian buffer is mostly attributed to the vast decrease in riparian buffer in the Upper Chewuch River (Figure 6). Within the Methow River watershed there is a total amount of approximately 320 km of bull trout migration habitat, 138 km of bull trout rearing habitat and 84 km of bull trout spawning habitat (Table 2).
Table 1: The quantitative assessment of WRIA 48 and its WAU subbasins after a GIS assessment of road density, change in forest cover, and change in riparian buffer (80m).
Habitat:
Not all of the subbasins in the Methow River watershed contain the same amount of bull trout habitat. The Twisp River subbasin contains the highest total amount of spawning, rearing and migration bull trout habitat at approximately 92 km (Figure 1). The Upper Chewuch, Upper Methow, and Wolf Creek also contain large amounts of bull trout habitat (Figure 1). While 15 of the WAU subbasins contain migratory habitat, only 7 subbasins contain spawning reaches (Table 2). The Twisp River subbasin contains the most spawning habitat at 21.57 km. The Lost River subbasin contains the second highest amount of spawning habitat at 16.96 km (Table 2). The Upper Chewuch River subbasin contains the highest amount of rearing habitat at 42.09 km (Table 2). The Upper Methow River contains the second highest amount of rearing habitat at 33.49 km. To see an individual breakdown of spawning, rearing and migration habitat view Table 2 and Figure 1.
Table 2: An itemization of bull trout spawning, rearing and migration habitat per WAU subbasin
Figure 1: Total amount of spawning, rearing and migration bull trout habitat for all Methow River subbasins
Road Density:
The Road Density Level table classifies the road density each of the WAU subbasins. Road densities > 1.3 km/km2 is represented in the red shade and is determined to be poor bull trout habitat. Road densities near 1.0 km.km2 are ranked as marginal bull trout habitat and given the orange shade. Road densities <1.0km/km2are ranked as optimal bull trout habitat are given the green shade. 70% of subbasins have a HIGH road density over 1.1 km/km2. The WAU subbasins that had the highest road densities were Bear Creek, Beaver/Lightning Creek, Benson Creek, Middle Methow River, and Texas Creek (Table 1). The WAU subbasins that had the lowest road densities were Alta Lake, Ashnola River, Lost River, Pasayten River, Upper Chewuch River and Upper Methow River. 3.45 km of spawning grounds are located in subbasins with HIGH road density. To see a visual representation of these results view Figure 1 below. To view a ranking scheme of the road densities on the subbasin level see Figure 2.
Figure 1: The effects of road density on bull trout life-cycle in the Methow River watershed and subbasins.
Figure 2: Watersheds where road density exceeds 1.1 km/km2 negatively affect bull trout populations according to the Upper Columbia bull trout assessment by the Washington Department of Fish and Wildlife (WDFW).
Forest Cover:
WRIA 48 and its WAU subbasins experienced increases and decreases in forest cover between the years of 1992 and 2006. WAU subbasins that saw the great increases in forest cover were Asnola River, Methow Gold Creek and Upper Methow River (Table 1). WAU subbasins that saw the great decrease in forest cover were Pasayten River and Wolf Creek (Table 1). For a visual representation of the forest cover results see Figure 4. There was an overall increase of forest cover with in WRIA 48 at a rate of 114.20 hectares new conifer and deciduous tree stands (Table 1). Subbasins that saw an increase in forest cover were given a green shade and ranked as optimal for bull trout habitat. Subbasins that saw any decrease in forest cover were given an orange or red shade and ranked as marginal or poor bull trout habitat respectively. The definition of forest area is any deciduous or coniferous forest stand, i.e. (Douglas fir, Cottonwood and Aspen). The definition of non-forested area represents low-level development, grassland, and brush. NOTE: Some large areas of forest change can be explained by wildfires in the area and not human interactions such as timber harvest or development.
Figure 4: The effects of forest change on bull trout life-cycle in the Methow River and subbasins between the years of 1992-2006.
Figure 3: The change in forest cover for each WAU subbasin in WRIA 48 between 1992 and 2006.
Riparian Buffer:
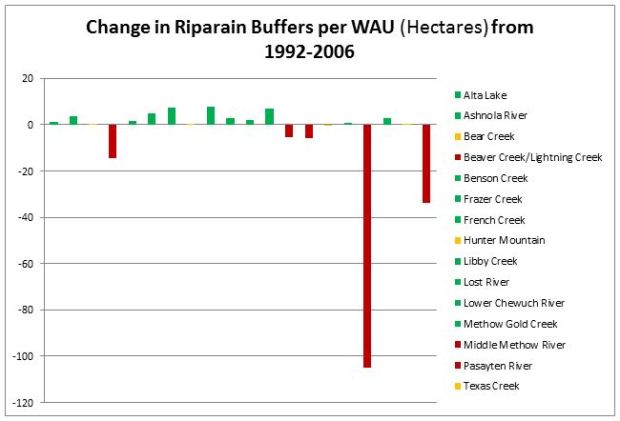
Deriving the results for change in riparian buffer was much like deriving the results for change in forest cover except the process looked at the change of forest within an 80 meter buffer along each stream with in the WAU subbasin. WAU subbasins that saw increases in riparian buffer were give a green shade and ranked as optimal habitat for bull trout. 25% of all subbasins experienced decrease in riparian buffer between the years of 1992 and 2006. WAU subbasins that saw increase or little decrease in riparian buffers were ranked as marginal bull trout habitat and given and orange shade. WAU subbasins that decreases in riparian buffer were give a red shade and ranked as poor bull trout habitat. WAU subbasins that saw the greatest increase of forest in their riparian buffer were French Creek, Libby Creek and Methow Gold Creek (Figure 5). WAU subbasins that saw the greatest decrease in riparian buffer were Beaver/Lightning Creek, Pasayten River, and the Upper Chewuch River (Figure 5). Overall, there was a total decrease of riparian buffer within WRIA 48 at a loss of about 6.11 hectares (Table 1). The assessment found that 13.26 km of spawning habitat lies within subbasins with decreased riparian buffers.
Figure 5: The Change in Riparian Buffer table evaluates the change in the 80 meter riparian buffer around all streams on the subbasin level between the years of 1992-2006.
Ranked Results:
To rank the results of GIS assessment of WRIA 48 and its WAU subbassins they were assigned quality points based on the criteria produced by WDFW and the Washington Department of Ecology (Table 2). The quality points were then totaled to rank the results of the subbasin assessment (Figure 6). Subbasins that met the criteria for healthy bull trout watersheds were assigned an “O” for optimal condition and allocated 3 habitat quality points. Subbasins that nearly met the criteria for healthy bull trout watersheds were assigned an “M” for marginal condition and allocated 1 habitat quality point. WAU subbasins that did not meet healthy bull trout watershed standards were given a “P” for poor condition and were allocated no habitat quality points. Out of all 20 Methow River subbasins, only 30% WAU subbasins were given the status of optimal bull trout habitat. 40% of all Methow River WAU subbasins were given the ranking of marginal bull trout habitat status. 30% of all Methow River WAU subbasins were listed as poor bull trout habitat (Figure 6).
Table 2: The ranking structure given to each WAU subbasin in WRIA 48.
Figure 6: WAU subbasin alongside each other to provide a visual depiction of the overall bull trout habitat health as defined by WDFW and the Washington Department of Ecology.


